
If you’ve ever dipped your toes into networking or cyber security, you’ve likely encountered the term PCAP file. But what is a PCAP file, and why is it so important in these fields?
Understanding PCAP files is essential for diagnosing network issues or analyzing security incidents. In the simplest terms, a PCAP file is like a digital diary of network traffic.
In this article, we’ll help you understand PCAP files, explain their importance, and show you how to read and analyze them. Finally, we’ll show you examples of why you’d want to engage in packet capture analysis.
If you’re ready to dive into the world of PCAP files, let’s begin.
What Is a PCAP File?
A PCAP file called “packet capture” contains captured wired or wireless network data, sometimes referred to as a packet dump or a capture file.
It contains a sequence of network packets, each including data such as the timestamp of its capture, its length, and the actual packet data.
PCAP files originated in the late 1980s as part of the tcpdump project, created by Van Jacobson, Craig Leres, and Steven McCanne, to capture and save network traffic on Unix-based systems. The format became a standard for network traffic analysis and has been widely adopted by tools like Wireshark.
PCAPs allow you to inspect network packets, providing insights into the traffic's contents and patterns.
Performing packet analysis helps you identify abnormal behaviors and network performance issues, while captured network traffic can be used to diagnose connectivity problems, packet loss, and latency issues.
Through this process, you can pinpoint network disruptions' exact location and cause by examining packet flows.
Network Packet Capture
Before we show you how traffic can be intercepted with packer sniffer tools like Wireshark, let’s see how information travels through a network using the OSI model by showing you how you’d access the StationX blog.
OSI Model
The OSI model is a framework that helps explain how different networking protocols interact to allow communication between devices in a network.
Application Layer (Layer 7)
You enter the StationX blog's URL in your web browser and press enter. The browser operates at the application layer and generates an HTTP request to retrieve the webpage.
Presentation Layer (Layer 6)
The data from the HTTP request is formatted and, if necessary, encrypted (e.g., HTTPS encryption).
Session Layer (Layer 5)
A session is established between your browser and the StationX web server, managing the communication session.
Transport Layer (Layer 4)
The session's data is segmented into smaller chunks, known as TCP segments or UDP datagrams. These are assigned port numbers to ensure they reach the correct application on the server.
TCP ensures reliable delivery by managing retransmissions and reordering segments if they arrive out of order, while UDP provides a faster but less reliable transmission.
Network Layer (Layer 3)
Each TCP segment is encapsulated into packets, and IP addresses are assigned to route them to the correct destination across the Internet.
Data Link Layer (Layer 2)
Packets are further encapsulated into frames, including MAC addresses for local delivery within networks.
Physical Layer (Layer 1)
Frames are converted into electrical, optical, or radio signals and transmitted over the physical medium (e.g., cables, Wi-Fi).
Returning data to you
The response from the web server follows the reverse path, starting from the physical layer at the server level and moving back up to the application layer on your device, where the browser processes and displays the StationX blog.

Now that you understand how data travels through a network let's explore how we can capture this data for closer inspection. Several tools are available for this purpose, but the two most popular ones are Wireshark and tcpdump.
tcpdump
Tcpdump is a command line tool typically installed on Linux-based systems that can quickly and easily capture network traffic.
You can start using it by opening a terminal and running tcpdump -i <interface> where <interface> is the network interface to monitor (e.g., eth0).
Use filters to capture specific traffic. For example, tcpdump -i eth0 port 80 captures HTTP traffic on port 80.
To save captured packets to a file, use tcpdump -i eth0 -w capture.pcap.
See The Ultimate tcpdump Cheat Sheet for more commands.
Wireshark
The most popular packet capture tool is Wireshark.
Launch Wireshark and select the network interface you want to monitor (e.g., eth0, Bluetooth).

Click on the "Start capturing packets" button (a blue shark fin icon) or double-click your desired interface. Wireshark will begin to capture packets passing through the selected interface.

For a detailed explanation of using Wireshark to capture network traffic, refer to our article How to Use Wireshark to Capture Network Traffic.
How to Read PCAP Files
Now that we've captured some network traffic, it's time to open a PCAP file and its important sections in Wireshark. You can do this in several ways.
One way is to use the command-line terminal in the folder containing the file you want to open.
wireshark <file>

Another one is to open it within Wireshark. Go to the "File" menu, select "Open," or use the shortcut Ctrl+O.

Then, select the file you want to work with.

The Menu Bar and Toolbar

This is the topmost part of the Wireshark window, which allows you to perform actions such as starting/stopping captures, saving and opening files, and accessing tools.
The Menu Bar includes drop-down menus (File, Edit, View, Go, Capture, Analyze, Statistics, Telephony, Wireless, Tools, Help) that provide access to various functions and settings.
The Toolbar below contains quick-access icons for starting and stopping captures, opening files, saving captures, applying filters, and other frequently used tools.
Information Security Courses Bundles
Want lifetime access to expert-led cyber security training? Explore our Information Security Course Bundles — one-time purchase packages covering top topics like Ethical Hacking, Cloud, Linux, DevSecOps, and CompTIA certifications.
Filter Bar

This section below the toolbar allows you to apply display filters to narrow the packet list to specific traffic types or criteria. You can enter display filters to isolate specific packets, such as “http,” “tcp.port == 80,” or “IP.addr == 192.168.1.1.”
Packet List Pane
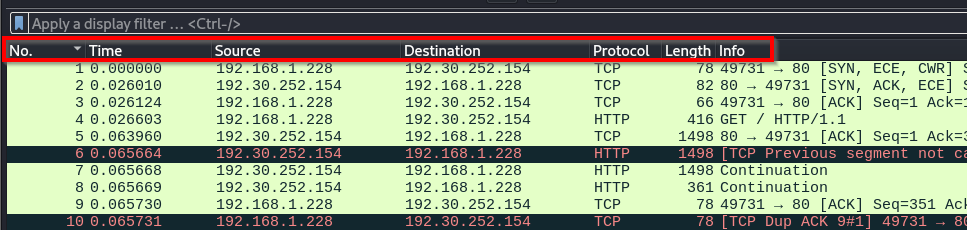
This is the upper section of the main window.
It displays a summary list of all captured packets in a tabular format, with columns for No., Time, Source, Destination, Protocol, Length, and Info, providing an overview of all captured packets.
Clicking on a packet in this pane highlights it and displays its details in the lower panes.
Packet Details Pane

Located in the middle section of the window, this pane shows a detailed, hierarchical view of the selected packet from the list.
This breaks down the chosen packet into its protocol layers (e.g., ethernet, IP, TCP) and shows detailed information about each layer's header fields and data.
Packet Bytes Pane
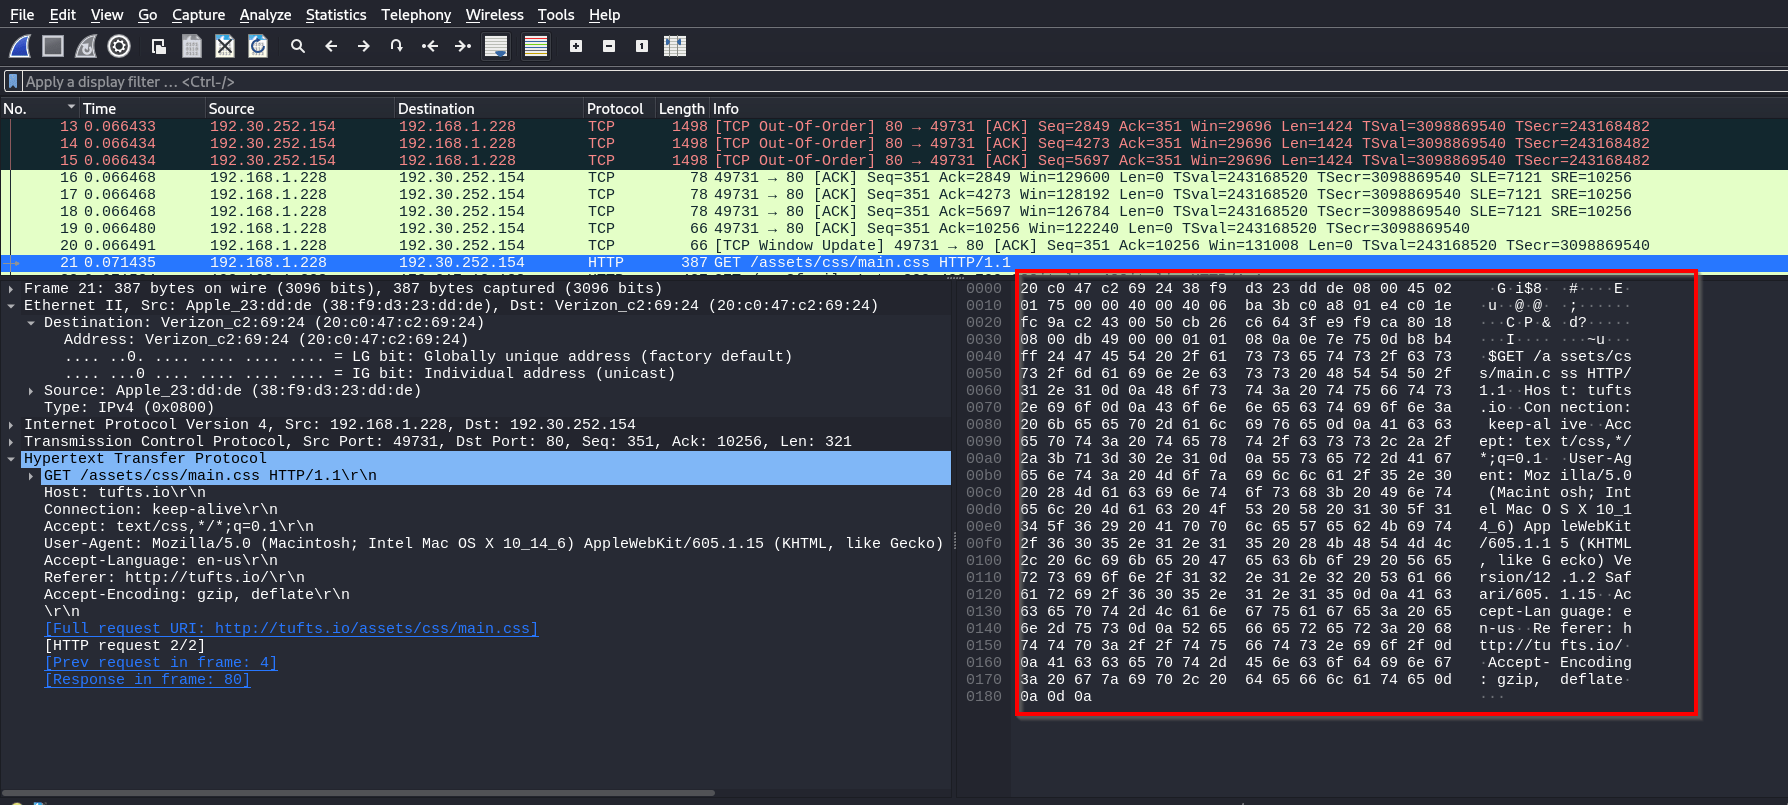
This is the bottom section of the window.
It displays the selected packet's raw data in hexadecimal and ASCII formats, allowing you to examine the bytes transmitted over the network, which is useful for troubleshooting.
Explore more of Wireshark with these essential articles.
How to Install Wireshark on Windows, macOS, and Linux
PCAP Analysis
Now that you've seen how Wireshark is laid out, let's analyze a PCAP file and examine the information we can extract.
For our example, let's assume that we've been tasked with capturing data using Wireshark and analyzing the information it contains as part of a penetration test.
Filtering Packets
By filtering packets in Wireshark based on protocols like HTTP and ARP, you can gain valuable insights into network activities and identify potential security issues.
For instance, ARP traffic can help you discover hosts on the network and understand its topology. This is important for effective enumeration.
To filter packets in Wireshark, enter the protocol you want to filter by in the display filter area.

To learn more about using Wireshark’s display filter, see our article Wireshark Cheat Sheet: All the Commands, Filters & Syntax.
Inspecting Packets
To inspect a packet, select one from the packet list pane. From here, we can inspect the data shown in the packet bytes pane.
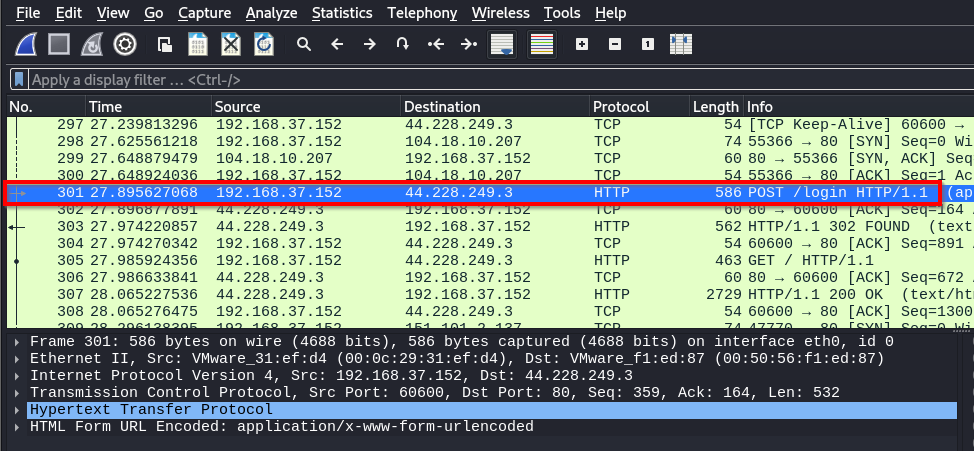
We have selected packet 301, an HTTP Post request to a web server. In the packet bytes pane, let’s examine the information provided for the packet.
Packet 301 includes information from several OSI layers: the data link layer (Ethernet II) showing MAC addresses, the network layer (IPv4) displaying source and destination IP addresses, the transport layer (TCP) with port numbers and control flags, and the application layer (HTTP) containing web data.
Data Link Layer
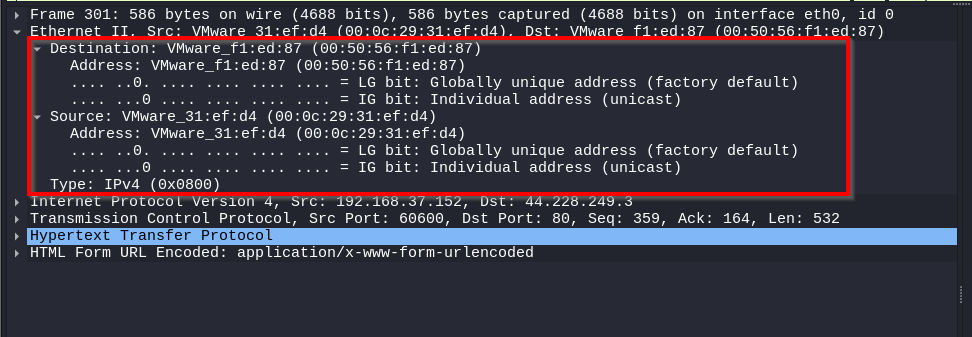
In the data link layer for packet 301, the Ethernet II header indicates the source and the destination MAC. The type field specifies that the payload is an IPv4 packet.
Network Layer
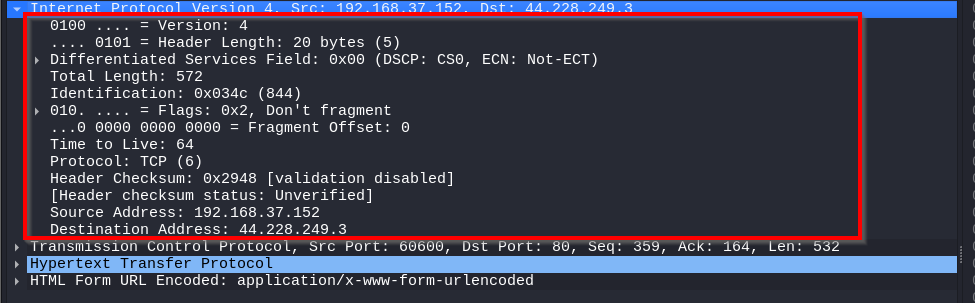
For the network layer information in packet 301, we’re looking at the IPv4 header. The IPv4 header indicates that the packet uses IPv4 and has a total length of 572 bytes. It originates from IP address 192.168.37.152 and is destined for IP address 44.228.249.3.
The packet is not fragmented, has a TTL (Time to Live) equal to 64, and uses the TCP protocol.
Transport Layer
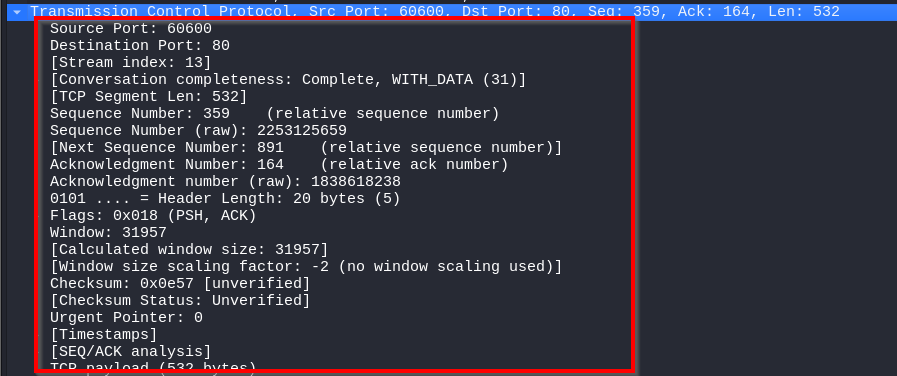
For the transport layer, we’re looking at the TCP header, which indicates the communication is between source port 60600 and destination port 80. The sequence and acknowledgment numbers manage data flow and ensure reliability.
The PSH and ACK flags are set, meaning that the data should be pushed to the receiving application immediately and that acknowledgment of received data is being sent.
The window size indicates how much data the receiver is willing to accept, and the checksum provides error-checking for the segment. The TCP payload size is 532 bytes.
Application Layer
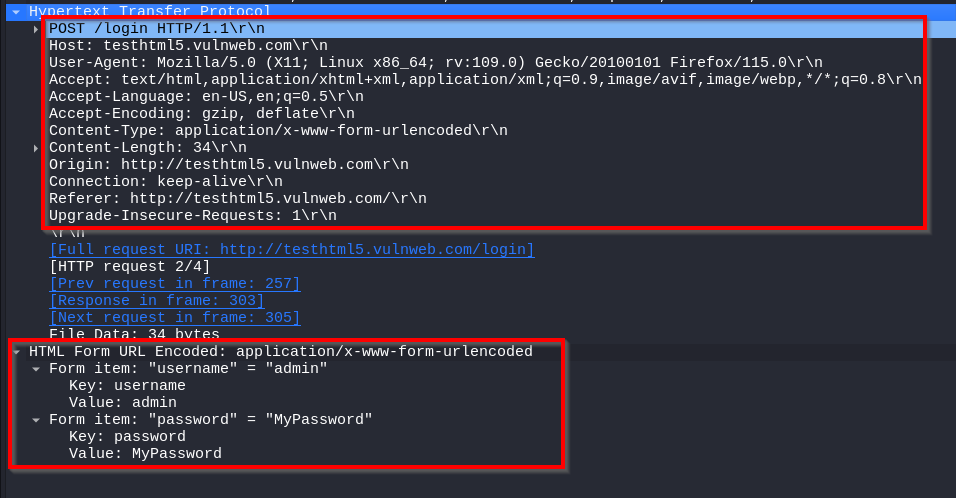
In the application layer, we see an HTTP POST request. It shows us a POST request to the /login URL on the server testhtml5.vulnweb.com.
The packet headers provide information about the client request, the content type, and the payload length.
The form data, which is URL-encoded, contains the admin’s username and password under MyPassword.
This shows you how sensitive login credentials transmitted in plaintext over HTTP can be found when capturing network traffic.
CompTIA Network+ Voucher
Prepare to validate your networking skills for less. Grab a CompTIA Network+ Voucher and save up to 30% on your exam through StationX’s authorized CompTIA partnership.
Follow Streams
Wireshark allows you to follow TCP or UDP streams, which enable you to see the data being sent and received between two endpoints. This can be a great way to find information hidden within network traffic that may not be immediately visible.
If you want to follow a stream in Wireshark, right-click on a packet and select Follow > TCP Stream.
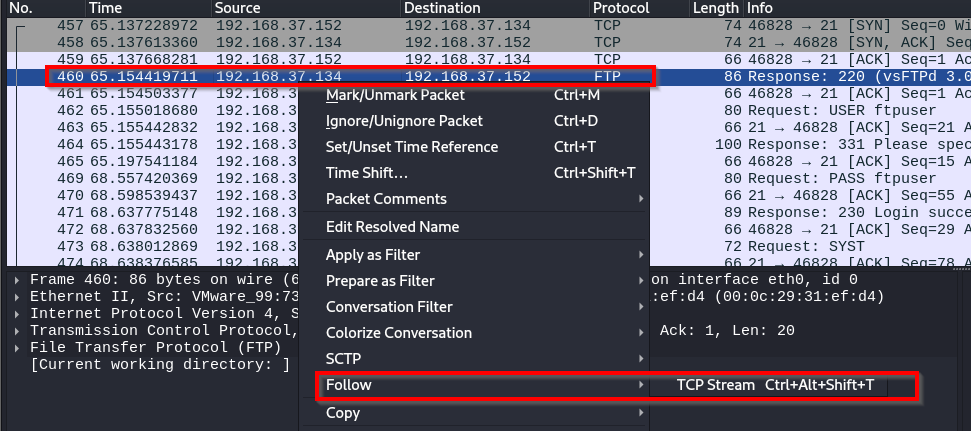
Wireshark then opens a window with the TCP stream information.
In our example, we see an FTP connection. If you look near the top of the message, you'll notice the username and password: ftpuser.
Scroll further down, and you'll see that the user transferred a file called "secretfile.txt."

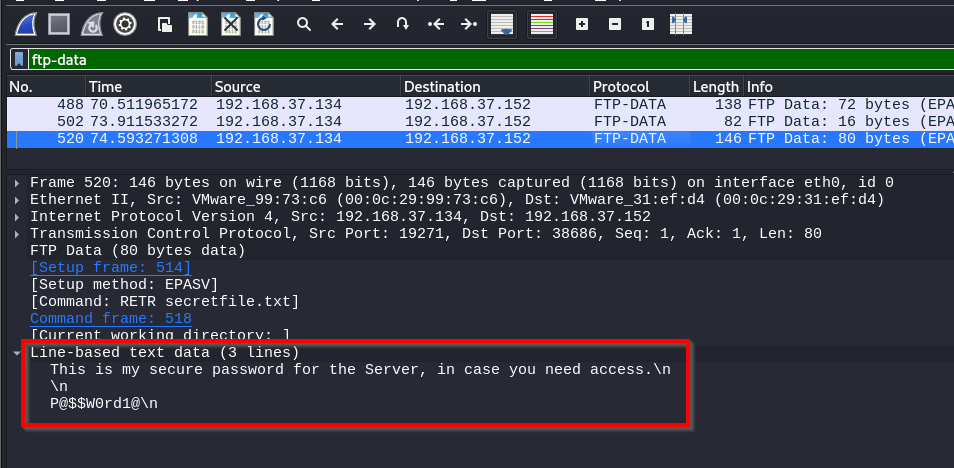
Read Data
Because the user utilized FTP instead of the more secure protocol SFTP, we can see the data in the file.
First, let’s use the display filter and filter for FTP-DATA, and then we’ll investigate packet 520. When we click on the packet, the file's contents are displayed.
Why Analyze PCAP Files?
Okay, so why would we want to analyze a PCAP file?
We’ve shown you one example as we intercepted traffic in a penetration test to find information. However, PCAP file analysis is important across various network and security areas.
Here are some other examples.
Network Administration and Troubleshooting
For network administrators, PCAP file analysis helps them diagnose and optimize network performance.
- PCAP files provide detailed information about traffic flow, which can help you diagnose network problems such as latency, packet loss, or congestion.
- You can analyze PCAP files to monitor network performance and ensure that all devices and applications operate efficiently.
- Understanding the behavior of various network protocols can help you optimize network performance and troubleshoot protocol-specific issues.
- PCAP files can be used to identify bandwidth usage patterns, allowing you to manage and allocate resources effectively.
Defensive Security
In defensive security, PCAP analysis is vital for detecting and responding to threats.
- Analyzing PCAP files enables security teams to identify signs of network intrusions, such as unusual traffic patterns or known attack signatures.
- During a security incident, PCAP files provide forensic evidence to understand the nature and extent of the breach, helping in containment and mitigation efforts.
- Security analysts use PCAP files to proactively search for hidden threats within the network, uncovering malicious activities that might have bypassed automated detection systems.
- Regular network traffic analysis can help organizations meet regulatory requirements by ensuring that security measures are in place and functioning as intended.
Offensive Security
In offensive security, PCAP analysis helps simulate attacks, develop exploits, and understand network behavior from an attacker's perspective.
- During a penetration test, analyzing PCAP files helps testers understand how their traffic interacts with the target network, identify potential vulnerabilities and validate their findings.
- PCAP analysis allows red teams to simulate advanced persistent threats (APTs) and other sophisticated attacks, providing insights into the target's defensive capabilities and weaknesses.
- Offensive security professionals use PCAP files to study network protocols and develop exploits by understanding how data flows through the network and identifying weak points.
- After gaining access to a network, analyzing traffic can help attackers maintain persistence, exfiltrate data, and evade detection by helping them understand normal traffic patterns and blend in.
Conclusion
This article showed you the importance of PCAP files across networks and in cyber security.
Understanding and analyzing the PCAP file format gives you a versatile and powerful tool for maintaining a network, defending it from threats, or testing its resilience.
Integrating PCAP analysis into your workflow enhances your ability to safeguard, defend, and improve network security.
To improve your networking or cyber security skills, join the StationX Master's Program today and leverage its many benefits, from over 30,000 online courses and labs to career and certification roadmaps. We have everything you need to succeed.
You can get lifetime access to the CompTIA Network+ Training Bundle (N10-009): 4 Courses for a one-time purchase. This bundle includes everything you need to study effectively and prepare with confidence: 35 hours of on-demand video, 5 full-length practice exams, 19 quizzes, 300+ flashcards, mobile access, and a certificate of completion.
This CompTIA Network+ Training Bundle (N10-009): 4 Courses contains:
- CompTIA Network+ Objectives: Total N10-009 Course
- CompTIA Network+ Study Guide: Master N10-009 Objectives
- CompTIA Network+ N10-009 Practice Test
- CompTIA Network+ Course: Practice Exam Flashcards
Frequently Asked Questions

Guarantee Your Cyber Security Career with the StationX Master’s Program!
Get real work experience and a job guarantee in the StationX Master’s Program. Dive into tailored training, mentorship, and community support that accelerates your career.
- Job Guarantee & Real Work Experience: Launch your cybersecurity career with guaranteed placement and hands-on experience within our Master’s Program.
- 30,000+ Courses and Labs: Hands-on, comprehensive training covering all the skills you need to excel in any role in the field.
- Pass Certification Exams: Resources and exam simulations that help you succeed with confidence.
- Mentorship and Career Coaching: Personalized advice, resume help, and interview coaching to boost your career.
- Community Access: Engage with a thriving community of peers and professionals for ongoing support.
- Advanced Training for Real-World Skills: Courses and simulations designed for real job scenarios.
- Exclusive Events and Networking: Join events and exclusive networking opportunities to expand your connections.
TAKE THE NEXT STEP IN YOUR CAREER TODAY!


